Image Details
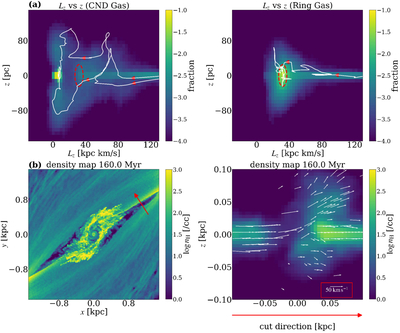
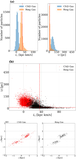
Caption: Figure 4.
(a) Heat maps of the orbital distribution in the Lz–z plane for CND gas (left) and ring gas (right). The color scale shows the particle fraction in each bin (logarithmic scale), and only bins with a fraction >1 × 10⁻⁴ are plotted. White lines trace representative particle trajectories. Red arrows indicate the direction of particle motion. The red dashed ellipse indicates the nuclear-ring region. (b) Left: face-on map of the mean hydrogen number density in the dust-lane region. Right: vertical slice along the direction marked by the red arrow in the left panel; the vertical axis measures the height above the midplane, and the white arrows indicate velocity vectors projected onto the slice. The slice averages over ±100 pc along the line of sight.
Other Images in This Article
Copyright and Terms & Conditions
© 2026. The Author(s). Published by the American Astronomical Society.