Image Details
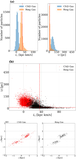
Caption: Figure 2.
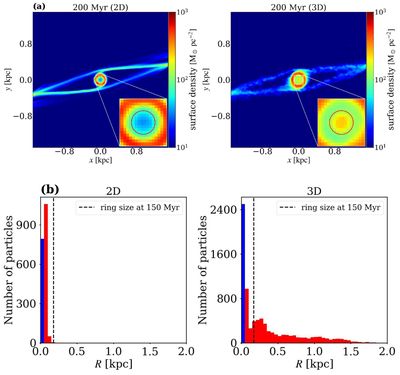
(a) Surface-density maps at t = 200 Myr for the pseudo-2D (left) and isothermal-3D (right) models. The red circle marks the CND region (r < 50 pc). (b) Radial distributions at t = 150 Myr of gas particles that are in the CND at t = 200 Myr, obtained by tracing those particles back to t = 150 Myr. Blue shows particles already inside the CND at t = 150 Myr, while red shows particles that were outside the CND at t = 150 Myr and entered it during 150–200 Myr. The dashed line indicates the ring radius at t = 150 Myr. In the pseudo-2D model, the CND is built almost entirely from gas already located inside the ring, whereas in the isothermal-3D model, a substantial fraction of the CND gas originates from outside the ring.
Other Images in This Article
Copyright and Terms & Conditions
© 2026. The Author(s). Published by the American Astronomical Society.