Image Details
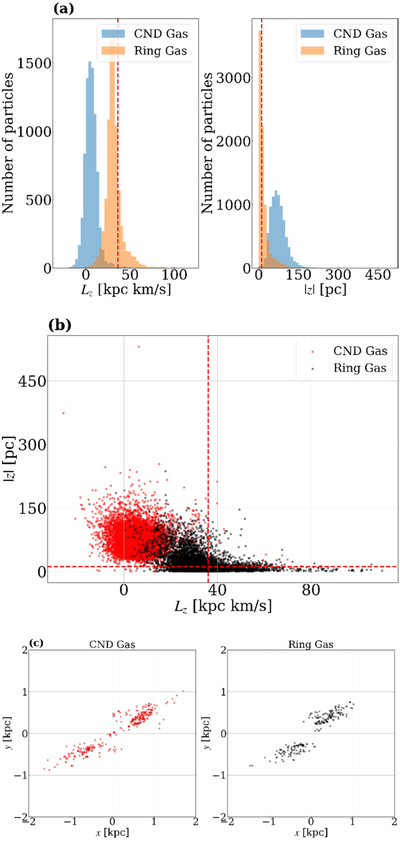
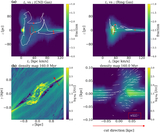
Caption: Figure 5.
(a) Histograms of Lz (left) and ∣z∣ (right) when CND and ring particles last crossed R = 380 pc. The red dashed lines show the time-averaged half-mass height and Lz inside the ring region. (b) Scatter plot of the same data in the Lz–∣z∣ plane. Red and black points correspond to CND and ring particles, respectively; the dashed lines again show the ring averages. (c) Locations of events where the magnitude of the angular momentum changes by −10 kpc km s−1 or more within 1 Myr. The left and right panels refer to the CND and ring samples, respectively.
Other Images in This Article
Copyright and Terms & Conditions
© 2026. The Author(s). Published by the American Astronomical Society.
Copyright ©
2026 Astronomy Image Explorer. All Rights Reserved.