Image Details
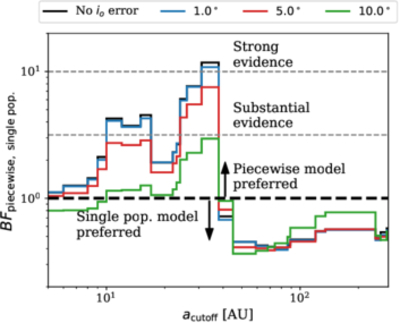
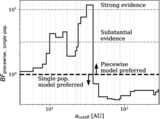
Caption: Figure 8.
The Bayes factor for the piecewise (two populations) and single population model. Each curve corresponds to different assumed orbital inclination errors (1°, 5°, 10°) to test the sensitivity of our Bayes factor calculations. The data in JA20 assumed no orbital inclination error (black curve, same as Figure 5). With errors included, we find that a peak remains at 31–38 au, although they are only supported with substantial evidence.
Other Images in This Article
Show More
Copyright and Terms & Conditions
© 2026. The Author(s). Published by the American Astronomical Society.
Copyright ©
2026 Astronomy Image Explorer. All Rights Reserved.