Image Details
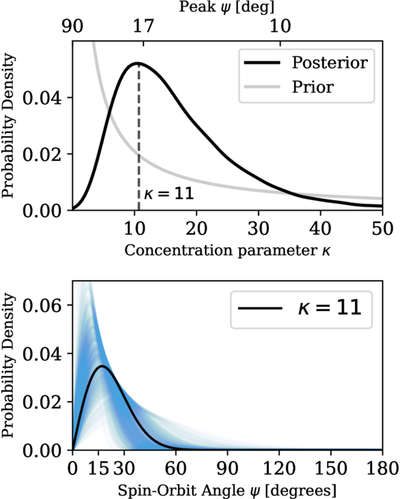
Caption: Figure 3.
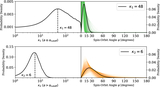
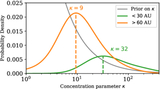
Top: posterior distribution of κ for the single population model. The mode and 68% HDPI is ﹩\kappa =1{1}_{-6}^{+10}﹩, corresponding to spin–orbit angle distributions peaking at ﹩\psi ={1{7}_{-5}^{+8}}^\circ ﹩. Bottom: 1000 spin–orbit angle distributions shown as blue curves, each corresponding to a sample from the κ posterior. In black is the ψ distribution for κ = 11, which peaks at 17°, signifying moderate spin–orbit alignment.
Other Images in This Article
Show More
Copyright and Terms & Conditions
© 2026. The Author(s). Published by the American Astronomical Society.
Copyright ©
2026 Astronomy Image Explorer. All Rights Reserved.