Image Details
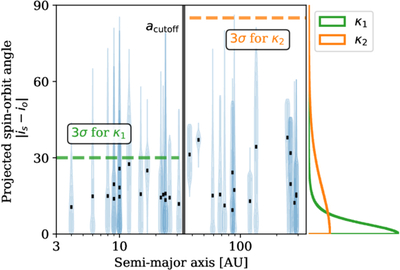
Caption: Figure 7.
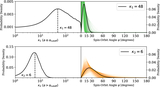
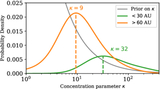
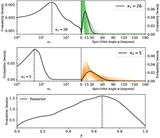
Projected spin–orbit angle ∣is − io∣ for each star in the JA20 dataset versus semimajor axis. In blue, the violin plot shows the probability distribution for each system, with black points indicating the median. The vertical black line separates the two populations at acutoff = 31–38 au. Interior (exterior) to acutoff, the green (orange) dotted line represents the 3σ bound of possible projected spin–orbit angles from the κ1 (κ2) posterior. Right: inferred population-level probability distributions of ∣is − io∣ computed from the posterior of κ1 and κ2 in Figure 6.
Other Images in This Article
Show More
Copyright and Terms & Conditions
© 2026. The Author(s). Published by the American Astronomical Society.
Copyright ©
2026 Astronomy Image Explorer. All Rights Reserved.