Image Details
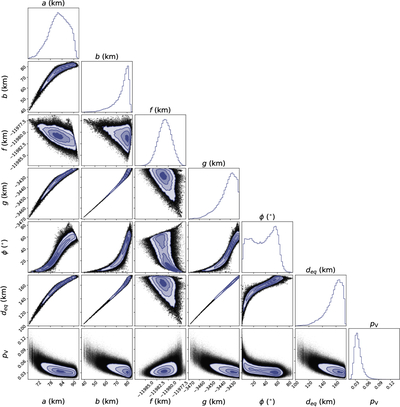
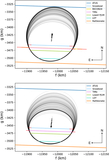
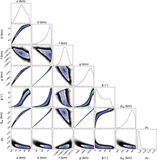
Caption: Figure 5.
Corner plot showing the posterior distribution from our MCMC ellipse fit, including the RECON24 chord. At the top of each column are the marginal (one-dimensional) posterior distributions for each parameter; beneath those, joint (two-dimensional) posterior distributions are shown for each pair of parameters. Contours show the 0.5σ, 1σ, 1.5σ, and 2σ confidence regions. Black points correspond to samples from the MCMC chain.
Other Images in This Article
Copyright and Terms & Conditions
© 2026. The Author(s). Published by the American Astronomical Society.
Copyright ©
2026 Astronomy Image Explorer. All Rights Reserved.