Image Details
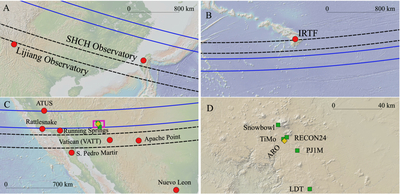
Caption: Figure 2.
Prediction maps for the three stellar occultations observed on (A) 2023 May 4, (B) 2023 May 24, and (C), (D) 2023 June 22. Dashed black lines represent the predicted shadow paths, while solid blue lines correspond to the actual shadow trajectories derived from updated orbital fits of Weywot (B. Proudfoot et al. 2025a). Red circles indicate observatories with negative detections, green squares indicate positive detections, and yellow diamonds denote technical issues (in this specific case, producing inconclusive data). Panel (D) provides a zoom-in of the pink rectangle region in panel (C). Maps were created using the free and open-source software QGIS v3.44.4 (Q. D. Team 2025) and the QuickMapServices catalog hosted by NextGIS (NextGIS 2024), specifically the Global Multi-Resolution Topography (W. B. F. Ryan et al. 2009). See Table 2 for observatory acronyms.
Other Images in This Article
Copyright and Terms & Conditions
© 2026. The Author(s). Published by the American Astronomical Society.