Image Details
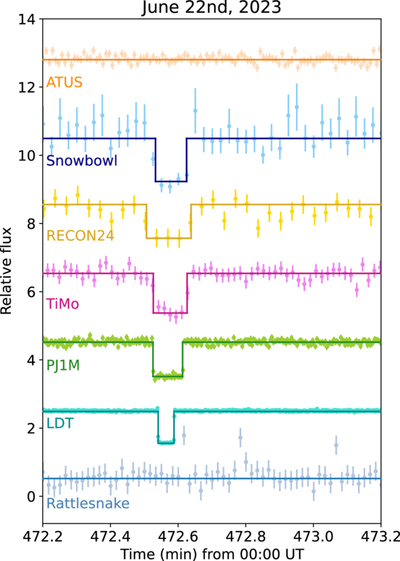
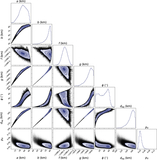
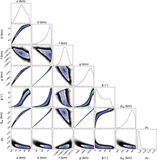
Caption: Figure 3.
Positive and closest negative occultation light curves on the 2023 June 22 event, ordered from the northernmost to the southernmost observing site. Data points represent the observational measurements, while the overlaid lines correspond to the best-fit square-well models. For the LDT dataset, the overlaid curve is shown using the timing from the convolved model, but does not represent the convolved model itself; the square-well profile is displayed for visualization purposes only. Flux offsets were added for visualization purposes.
Other Images in This Article
Copyright and Terms & Conditions
© 2026. The Author(s). Published by the American Astronomical Society.
Copyright ©
2026 Astronomy Image Explorer. All Rights Reserved.