Image Details
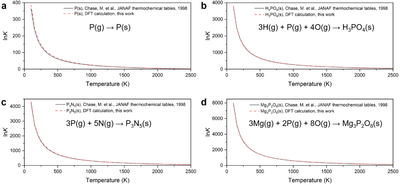
Caption: Figure 6.
Assessment of DFT calculation: comparison with experimental data from thermodynamical tables (M. W. Chase 1998). Panels (a)–(d) represent the equilibrium constant as a function of temperature at 1 bar for different bulk systems. The solid black line represents the experimental data, and the dashed red line represents the DFT calculation results.
Other Images in This Article
Copyright and Terms & Conditions
© 2026. The Author(s). Published by the American Astronomical Society.
Copyright ©
2026 Astronomy Image Explorer. All Rights Reserved.