Image Details
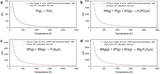
Caption: Figure 2.
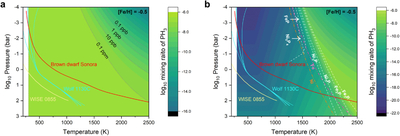
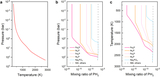
Comparison of predicted PH3 equilibrium abundances in the presence and absence of metal phosphides ([Fe/H] = −0.5). (a) Predicted PH3 equilibrium abundances in the absence of metal phosphides. (b) Predicted PH3 equilibrium abundances in the presence of metal phosphides. The gray dotted lines show the PH3 abundance contours in panel (a). The white dashed lines represent the condensation lines of the corresponding metal phosphides in panel (b). The pink and orange dashed–dotted lines represent the condensation lines (solid or liquid phase) of Fe and Ni elements, respectively. The solid lines are the T−P profiles of three brown dwarfs: brown dwarf Sonora (red), WISE 0855 (yellow) and Wolf 1130C (blue). The three blue lines are the median (center line) and ±1σ uncertainty boundaries (side lines) for the T−P profiles of Wolf 1130C.
Other Images in This Article
Copyright and Terms & Conditions
© 2026. The Author(s). Published by the American Astronomical Society.