Image Details
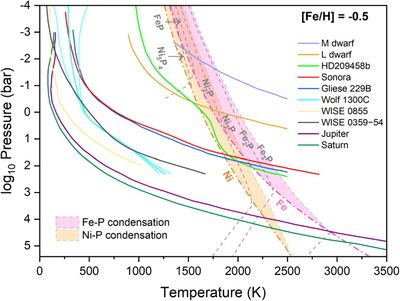
Caption: Figure 4.
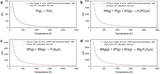
The scheme for predicting the presence or absence of PH3 across substellar atmospheres in the presence of metal phosphides ([Fe/H] = −0.5). The pink and orange areas represent the formation areas of Fe phosphide and Ni phosphide, respectively. The gray dashed line represents the condensation line of the corresponding metal phosphides. The pink and orange dashed–dotted lines represent the condensation lines (solid or liquid phase) of Fe and Ni elements, respectively. The solid lines are the temperature–pressure profiles of different substellar objects. The following are the references for the data: M dwarf (T. Tsuji et al. 1996), L dwarf (A. Burrows et al. 2006), HD 209458b (N. Iro et al. 2005), WISE 0359–54 (H. Kothari et al. 2024), Gliese 229B (M. S. Marley et al. 1996), and Jupiter and Saturn (T. Guillot 2005).
Other Images in This Article
Copyright and Terms & Conditions
© 2026. The Author(s). Published by the American Astronomical Society.