Image Details
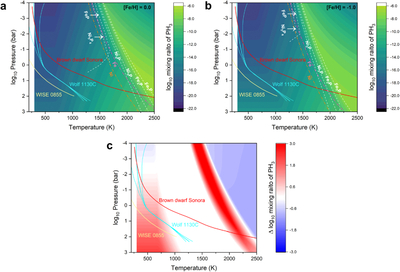
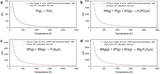
Caption: Figure 3.
Comparison of predicted PH3 equilibrium abundance at high- and low-metallicity atmosphere. (a) Predicted PH3 equilibrium abundance at high-metallicity atmosphere with [Fe/H] = 0.0. (b) Predicted PH3 equilibrium abundance at low-metallicity atmosphere with [Fe/H] = −1.0. (c) Logarithmic difference of predicted PH3 equilibrium abundance for [Fe/H] = −1.0 to [Fe/H] = 0.0. The red area represents the relative enrichment of PH3, and the blue area represents the relative depletion of PH3. All other symbols and curves are the same as those in Figure 2.
Other Images in This Article
Copyright and Terms & Conditions
© 2026. The Author(s). Published by the American Astronomical Society.
Copyright ©
2026 Astronomy Image Explorer. All Rights Reserved.