Image Details
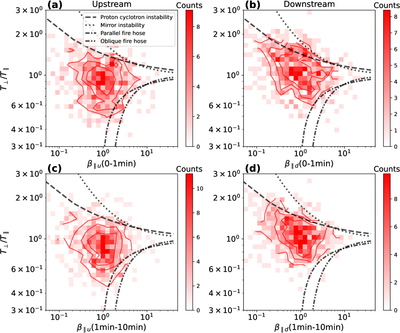
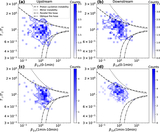
Caption: Figure 4.
Statistical distribution of (T⊥/T∥, β∥) upstream and downstream of fast-forward shocks. The black dashed or dotted lines indicate theoretical thresholds for various instabilities with growth rate γ = 10−3 ωcp (dotted: mirror instability; dashed: proton cyclotron instability; dashed–dotted: parallel fire-hose instability; dashed–dotted–dotted: oblique fire-hose instability). The top panels show the 0–1 minute interval immediately near the shock, while the bottom panels show the 1–10 minute interval farther from the shock. These time windows correspond to those used in Figure 3. Red contours represent the density distribution, and its levels span from 10% to 50% of the maximum value with equal spacing.
Other Images in This Article
Copyright and Terms & Conditions
© 2026. The Author(s). Published by the American Astronomical Society.