Image Details
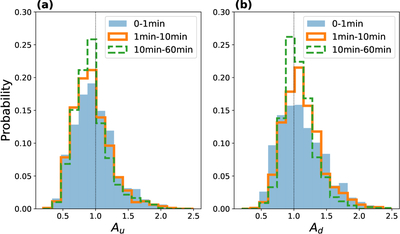
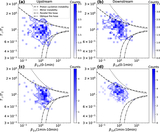
Caption: Figure 3.
Probability distributions of proton temperature anisotropy A at different time intervals relative to the shock front. The left and right panels show upstream and downstream distributions, respectively. Distributions are computed for increasing time windows from the shock: blue (0–1 minute), orange (1–10 minutes), and green dashed (10–60 minutes). Shorter intervals reveal stronger anisotropy near the shock, while longer intervals approach more isotropic solar wind conditions.
Other Images in This Article
Copyright and Terms & Conditions
© 2026. The Author(s). Published by the American Astronomical Society.
Copyright ©
2026 Astronomy Image Explorer. All Rights Reserved.