Image Details
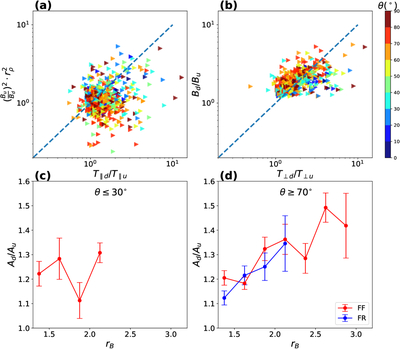
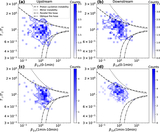
Caption: Figure 2.
Comparison of observed downstream-to-upstream proton temperature ratios with CGL predictions. Panels (a) and (b) show the parallel (T∥d/T∥u) and perpendicular (T⊥d/T⊥u) temperature ratios, respectively, with markers color-coded by shock obliquity. The dashed line denotes the temperature ratio predicted by the CGL double-adiabatic model based on magnetic-field and density compression. Deviations from this line indicate the influence of nonadiabatic and kinetic processes across the shock. Panels (c) and (d) show the relative change in temperature anisotropy, Ad/Au, as a function of the magnetic compression ratio rB for quasi-parallel (c) and quasi-perpendicular (d) shocks, respectively.
Other Images in This Article
Copyright and Terms & Conditions
© 2026. The Author(s). Published by the American Astronomical Society.