Image Details
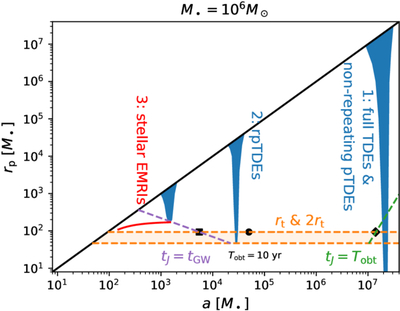
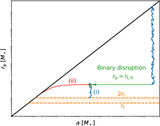
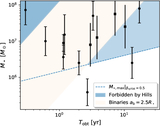
Caption: Figure 1.
Schematic plot showing the formation of full TDEs, non-rpTDEs, rpTDEs, and stellar extreme mass ratio inspirals (EMRIs) in a nuclear stellar cluster around an SMBH with M• = 106 M⊙, where rp and a are the pericenter distance and semimajor axis of the stellar orbit, respectively. The line tJ = Tobt marks the boundary between the full and empty loss-cone regimes. The region on the right-hand side of the black diamond (♦) symbol, a > afull (see Equation (6)) is where full TDEs and non-rpTDEs are expected to occur. The line tJ = tGW marks the boundary between the GW-emission- and two-body-scattering-dominated regimes. The region between the black square (■) and the black bullet (•) symbol, aGW(rp = 2rt) < a < a(Tobt = 10 yr) (see Equation (9)), is where observable rpTDEs (with a period less than 10 yr) are expected to occur.
Other Images in This Article
Copyright and Terms & Conditions
© 2026. The Author(s). Published by the American Astronomical Society.