Image Details
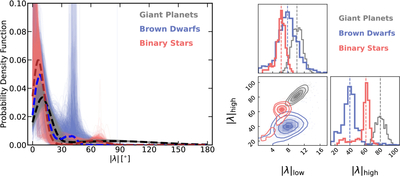
Caption: Figure 3.
Left panel: Gaussian mixture model fitting to the ∣λ∣ distribution of giant planets (gray, 0.3 ≤ Mc < 13.6 MJ), brown dwarfs (blue, 13.6 ≤ Mc < 80 MJ) and binary stars (red, Mc ≥ 80 MJ), based on 2000 randomly generated synthetic datasets (see Section 4 for details). The median results are shown as dashed curves. The low-∣λ∣ components of binary stars and brown dwarfs are slightly more concentrated and close to zero compared with the giant-planet population. Right panel: the low and high obliquity components' mean value distributions of giant planets (gray), brown dwarfs (blue), and binary stars (red), based on two-component Gaussian mixture model fittings to 1000 simulated synthetic datasets. The vertical dashed lines show the 50th quantiles of the distributions.
Other Images in This Article
Copyright and Terms & Conditions
© 2026. The Author(s). Published by the American Astronomical Society.