Image Details
Caption: Figure 1.
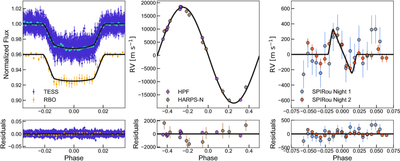
Left panel: the phase-folded TESS and RBO light curves. The light-blue dots are the binned TESS light curve with a binning size of about 180 s. Middle panel: the out-of-transit radial velocities from HPF and HARPS-N. Right panel: the two-night SPIRou RM measurements after subtracting the best Keplerian model. The plotted error bars are the quadrature sums of the uncertainties of individual measurements and the jitters. The best-fit models are shown as black curves in each plot. The residuals are presented in three bottom panels.
Other Images in This Article
Copyright and Terms & Conditions
© 2026. The Author(s). Published by the American Astronomical Society.
Copyright ©
2026 Astronomy Image Explorer. All Rights Reserved.