Image Details
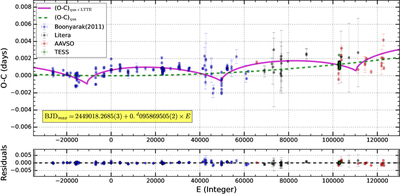
Caption: Figure 1.
O − C diagram of BE Lyn (with the linear ephemeris subtracted). The top panel shows the data and the best-fit model (magenta solid line), with the quadratic component indicated by the green dashed line. The bottom panel displays the residuals. Data sources are color-coded: C. Boonyarak et al. (2011; blue), historical literature (J. Hubscher et al. 2013; J. Hubscher 2014; J. H. Peña et al. 2015; J. Hübscher 2017; L. Pagel 2021, 2022, 2023; gray), AAVSO (red), and TESS (green).
Other Images in This Article
Copyright and Terms & Conditions
© 2026. The Author(s). Published by the American Astronomical Society.
Copyright ©
2026 Astronomy Image Explorer. All Rights Reserved.