Image Details
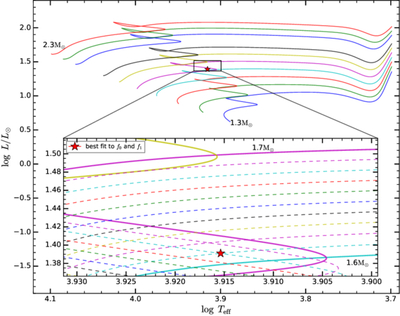
Caption: Figure 2.
Hertzsprung–Russell diagram showing evolutionary tracks (colored solid lines from the zero-age main sequence, ZAMS, to post-MS) and the best-fit seismic model for BE Lyn’s primary (red star). Black rectangles highlight zoomed-in views around the best-fit solutions. Colored dashed lines indicate tracks with a 0.01M⊙ mass step.
Other Images in This Article
Copyright and Terms & Conditions
© 2026. The Author(s). Published by the American Astronomical Society.
Copyright ©
2026 Astronomy Image Explorer. All Rights Reserved.