Image Details
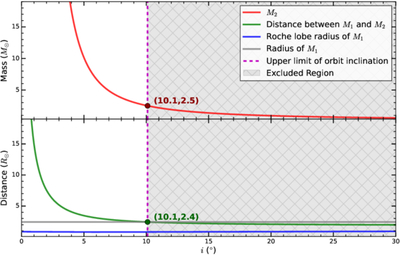
Caption: Figure 3.
Dynamical constraints on the unseen companion. Top: companion mass M2 versus orbital inclination i, derived from the mass function (red curve). Bottom: primary-companion separation at periastron versus i (green curve). The intersection of the primary’s radius R1 (gray curve) and primary-companion separation (green curve) sets the stringent upper limit i ≲ 10﹩\mathop{.}\limits^{\unicode{x000b0}}﹩1 (dark green dot), corresponding to the lower mass limit M2 ≳ 2.5M⊙ (dark red dot). The gray hatched region denotes parameter space excluded.
Other Images in This Article
Copyright and Terms & Conditions
© 2026. The Author(s). Published by the American Astronomical Society.
Copyright ©
2026 Astronomy Image Explorer. All Rights Reserved.