Image Details
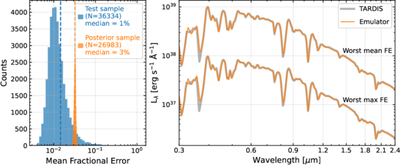
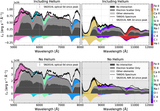
Caption: Figure B1.
Left: distribution of the mean fractional error in flux evaluated using the test dataset and posterior parameter samples. The vertical dashed lines mark the median of each distribution. Right: the comparison of the TARDIS and emulator spectra of two parameter sets that yield the worst fractional errors within the sampled posterior set.
Other Images in This Article
Copyright and Terms & Conditions
© 2026. The Author(s). Published by the American Astronomical Society.
Copyright ©
2026 Astronomy Image Explorer. All Rights Reserved.