Image Details
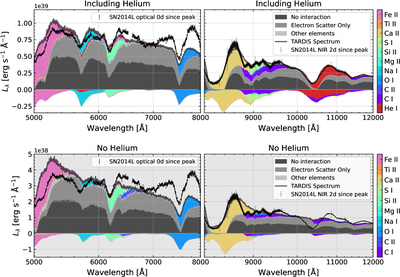
Caption: Figure 4.
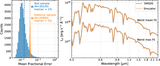
The SDEC plot shows the spectral-energy decomposition for the TARDIS spectrum evaluated using the MAP parameter set (top row) compared with an inference run in which we remove He (bottom row). The optical region (left column) remains nearly identical between the two models, with no major differences in the strong-line profiles. In contrast, the NIR region (right column) demonstrates that the 1 μm feature cannot be reproduced without He. For reference, we also plot the observed spectra; however, these are not continuum-matched to the synthetic spectra.
Other Images in This Article
Copyright and Terms & Conditions
© 2026. The Author(s). Published by the American Astronomical Society.
Copyright ©
2026 Astronomy Image Explorer. All Rights Reserved.