Image Details
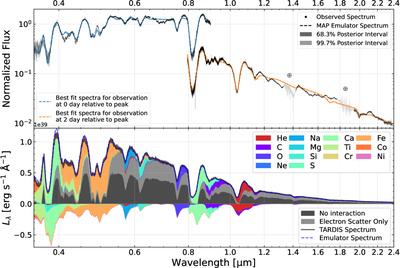
Caption: Figure 2.
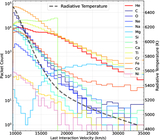
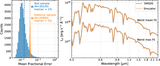
Top: the spectral comparison of the observed spectra and the MAP spectra. The observed spectra are plotted as black points with 1σ error bars. The normalized and continuum-matched emulator spectrum evaluated with the MAP parameter set is plotted in blue and orange for the optical and the NIR spectrum, respectively. Note that the two inferred spectra share the same parameters except the luminosity and time, which are locked in a ratio based on observation. The dark and light shaded regions around the MAP spectra indicate the 68.3% and 99.7% credible posterior probability intervals, respectively. We mark the masked-out telluric regions in the NIR with the ⊕ symbol. Bottom: we demonstrate that the emulator spectra (blue dashed line) closely resemble the TARDIS simulation (gray solid line) evaluated with the MAP parameter set. The elemental decomposition plot of the TARDIS simulation is overlaid, representing the interaction type or ion contribution of the energy packets during the last interaction in the simulation.
Other Images in This Article
Copyright and Terms & Conditions
© 2026. The Author(s). Published by the American Astronomical Society.