Image Details
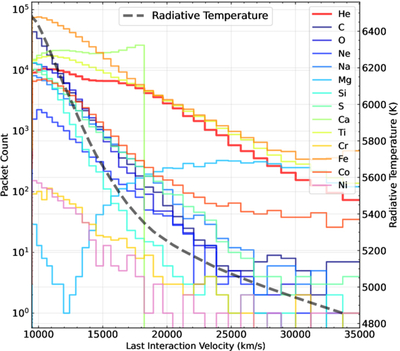
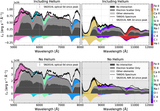
Caption: Figure 5.
The last line interaction velocity distribution of the TARDIS simulation run with the MAP parameter set. Each line represents the velocity distribution of the packets that line-interact with a specific element as their last interaction before crossing the outermost simulation boundary.
Other Images in This Article
Copyright and Terms & Conditions
© 2026. The Author(s). Published by the American Astronomical Society.
Copyright ©
2026 Astronomy Image Explorer. All Rights Reserved.