Image Details
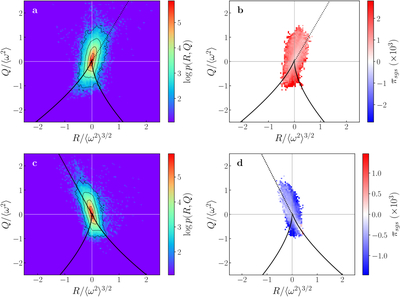
Caption: Figure 4.
Joint PDFs of Q and R GTGIs (a) and bin-averaged energy transfer rate in the RQ-plane (b) for P ≫ 0. The thick black line is the discriminant line obtained for ﹩{\bar{P}}_{\gg }=0.07﹩, and the dotted line indicates the ﹩{\bar{P}}_{\gg }Q-R=0﹩ curve. Joint PDFs of Q and R GTGIs (c) and bin-averaged energy transfer rate in the RQ-plane (d) for P ≪ 0. The thick black line is the discriminant line obtained for ﹩{\bar{P}}_{\ll }=-0.06﹩, and the dotted line indicates the ﹩{\bar{P}}_{\ll }Q-R=0﹩ curve. GTGI values are normalized to powers of the enstrophy 〈ω2〉.
Other Images in This Article
Copyright and Terms & Conditions
© 2026. The Author(s). Published by the American Astronomical Society.
Copyright ©
2026 Astronomy Image Explorer. All Rights Reserved.