Image Details
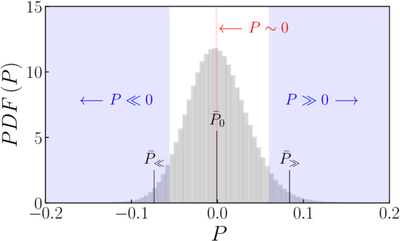
Caption: Figure 2.
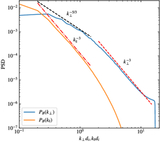
PDF of the first GTGI P = −∇ · u. Shaded areas indicate P ≪ 0 and P ≫ 0 (blue) and P ∼ 0 (red) regimes. Vertical lines indicate the median values ﹩{\bar{P}}_{\ll }=-0.06﹩, ﹩{\bar{P}}_{0}=-1.2\times 1{0}^{-3}﹩, and ﹩{\bar{P}}_{\gg }=0.07﹩ inside each subset.
Other Images in This Article
Copyright and Terms & Conditions
© 2026. The Author(s). Published by the American Astronomical Society.
Copyright ©
2026 Astronomy Image Explorer. All Rights Reserved.