Image Details
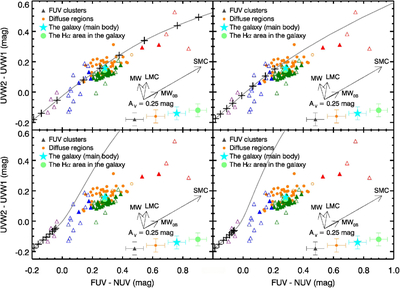
Caption: Figure 4.
UVW2−UVW1 as a function of FUV−NUV. The symbols, the color-coding of the data points, and the arrows are the same as assigned in the right panel of Figure 3, but the superimposed GALAXEV model curve is reproduced with exponentially decreasing SFR with the SF timescale τSF = 0.01 (top left panel), 0.1 (top right panel), 0.5 (bottom left panel), and 1 Gyr (bottom right panel). The black crosses mark the positions of the same ages as assigned in the right panel of Figure 3, with the rightmost cross representing 400 Myr, but some of the left-side crosses in Figure 3 exceed the axis range in this figure.
Other Images in This Article
Copyright and Terms & Conditions
© 2026. The Author(s). Published by the American Astronomical Society.
Copyright ©
2026 Astronomy Image Explorer. All Rights Reserved.