Image Details
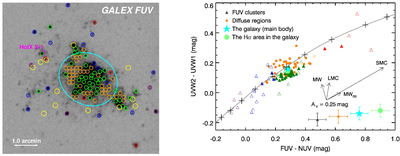
Caption: Figure 3.
Left: GALEX-FUV inverse-brightness image for Holmberg IX, where the FUV clusters, the diffuse regions, and the main body of the galaxy as a whole, the Hα-emission area in the galaxy, HoIX X-1, and the foreground stars are marked. Cyan ellipse, yellow and magenta circles are the same as assigned in Figure 1; all of the other circles represent photometric apertures for the FUV clusters and the diffuse regions. The apertures for the FUV clusters are color-coded by FUV−NUV: FUV−NUV < 0.0 mag (purple), 0.0 ≤ FUV−NUV < 0.2 mag (blue), 0.2 ≤ FUV−NUV < 0.4 mag (green), and FUV−NUV ≥ 0.4 mag (red); the apertures for the diffuse regions are in orange. The scale ruler at the bottom left corner indicates the 1﹩\mathop{.}\limits^{{\rm{^{\prime} }}}﹩0 length; north is up, and east is to the left. Right: UVW2−UVW1 as a function of FUV−NUV for the FUV clusters (triangles), the diffuse regions (orange circles), the main body of the galaxy as a whole (cyan-filled star), and the Hα-emission area in the galaxy (green-filled circle), with a GALAXEV model curve superimposed (gray solid line). The FUV clusters and the diffuse regions inside the cyan-elliptical aperture are represented by filled symbols, while those outside that are represented by open ones. The color-coding for the FUV clusters is the same as in the left panel. The model curve shows an age sequence with black crosses marking the positions of the 10 ages, 3.8, 10, 20, 40, 80, 130, 210, 300, 360, and 400 Myr from left to right. The arrows show the vectors predicting the effects of the dust attenuation at the amount AV = 0.25 mag for the Milky Way (MW), the Large Magellanic Cloud (LMC), and the Small Magellanic Cloud (SMC) laws, as well as the attenuation law with the MW-type slope but no 2175 Å bump (denoted as MW0B in the diagram). The quotation and the construction of the attenuation laws are presented in Y.-W. Mao et al. (2014). The median errors for the FUV clusters (blue), the diffuse regions (orange), the main body of the galaxy as a whole (cyan), and the Hα-emission area in the galaxy (green) are plotted at the bottom right corner.
Other Images in This Article
Copyright and Terms & Conditions
© 2026. The Author(s). Published by the American Astronomical Society.