Image Details
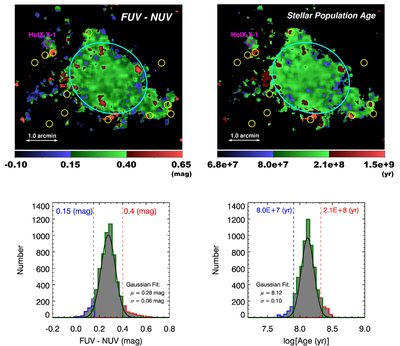
Caption: Figure 2.
Top: 2D maps of the color index FUV−NUV (left) and stellar population age (right) for Holmberg IX, where cyan ellipse, yellow and magenta circles are the same as assigned in Figure 1; the scale numbers of the color bars are in units of magnitude (left) and year (right), respectively; the scale ruler in the bottom left corner indicates the 1﹩\mathop{.}\limits^{{\rm{^{\prime} }}}﹩0 length; north is up, and east is to the left. Bottom: histograms of the color index FUV−NUV (left) and stellar population age (right) for Holmberg IX enclosed in the elliptical aperture, derived from corresponding 2D maps in the top panels, where black solid lines are the best-fit Gaussian profiles, and dashed lines demarcate boundaries in accordance with the 2σ range, identical to the color bars in the above 2D maps.
Other Images in This Article
Copyright and Terms & Conditions
© 2026. The Author(s). Published by the American Astronomical Society.