Image Details
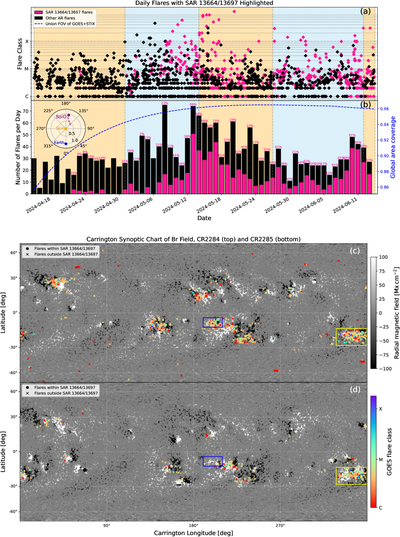
Caption: Figure 1.
Overview of global flares occurring during the SAR 13664/13697 lifetime. Panels (a) and (b) shows the flare magnitude and count number of flares on a daily basis with flares within (outside) SAR 13664/13697 in pink (black) colors. The light-blue and light-orange shades indicate the time interval during which SAR 13664/13697 was on the near side (observed by GOES) and far side of the Sun (observed by STIX), respectively. The blue dashed curve plots the percentage of the global area covered by the joint perspective of GOES and SolO. The fraction number on the top of bars in (b) gives the daily percentage of SAR 13664/13697 flares over all the flares. The inset illustrates in the ecliptic plane the relative positions of the Sun (orange), Earth (blue), and SolO (purple) as well as its trajectory during the SAR 13664/13697 lifetime. Panels (c) and (d) show the spatial distribution of flares that occurred during the Carrington rotation 2284 (2024 May 6–June 2) and 2285 (June 2–29), respectively. The “o” (“x”) symbol marks flares within (outside) SAR 13664/13697. The flare magnitude is color-coded, from strong (purple) to weak (red). The yellow (blue) box marks the range of SAR 13664/13697 (AR 13679/13711).
Other Images in This Article
Copyright and Terms & Conditions
© 2026. The Author(s). Published by the American Astronomical Society.