Image Details
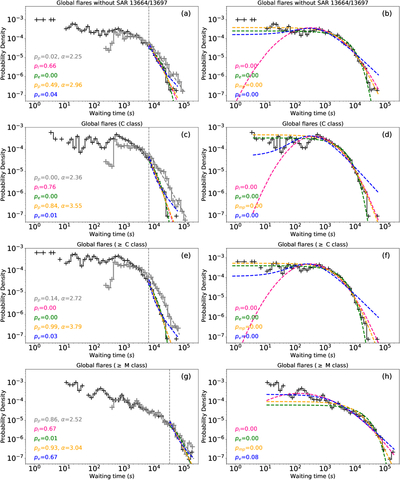
Caption: Figure 3.
WTDs of global flares. The format is the same as Figure 2. For the WTD in the same row, left (right) panel shows the fitting of the tail portion (overall profile). In the left column, the corresponding WTD of near-side flares observed by GOES is shown in gray; its tail, starting from the same ﹩{x}_{{\rm{\min }}}﹩ as that of the global WTD, is fitted by a power law, and the resultant p-value and power-law index are annotated.
Other Images in This Article
Copyright and Terms & Conditions
© 2026. The Author(s). Published by the American Astronomical Society.
Copyright ©
2026 Astronomy Image Explorer. All Rights Reserved.