Image Details
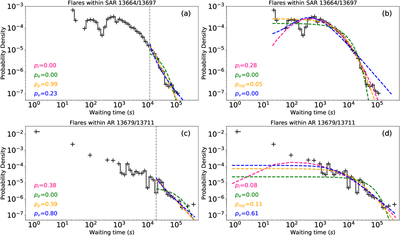
Caption: Figure 2.
WTDs of flares within individual ARs. Panels (a) and (b) show the WTD of flares within SAR 13664/13697; the tail portion is fitted in (a) and the overall profile in (b). The vertical dashed line indicates ﹩{x}_{{\rm{\min }}}﹩ as determined by minimizing the KS distance for the power law. The p-values of the KS tests are shown with subscripts “l,” “e,” “p”/“mp,” and “v,” indicating log-normal (pink), exponential (green), power-law (gold), and Lévy (blue) functions, respectively. Panels (c) and (d) show the WTD of flares within AR 13679/13711 in the same style as panels (a) and (b).
Other Images in This Article
Copyright and Terms & Conditions
© 2026. The Author(s). Published by the American Astronomical Society.
Copyright ©
2026 Astronomy Image Explorer. All Rights Reserved.