Image Details
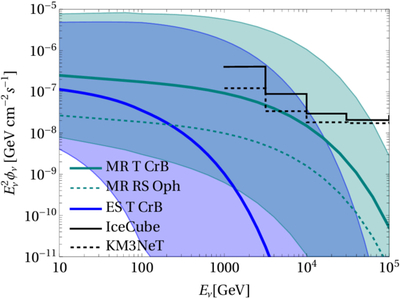
Caption: Figure 3.
Muon neutrino flux from MR model (shown in green) compared with that from the ES model (shown in blue) for T CrB. The green curves depict the fluxes for T CrB (solid) and RS Oph (dotted) corresponding to the benchmark parameters in Table 2, whereas the green band shows the uncertainties due to parameter variations. The sensitivities of IceCube and KM3NeT are same as in the Figure 2.
Other Images in This Article
Copyright and Terms & Conditions
© 2026. The Author(s). Published by the American Astronomical Society.
Copyright ©
2026 Astronomy Image Explorer. All Rights Reserved.