Image Details
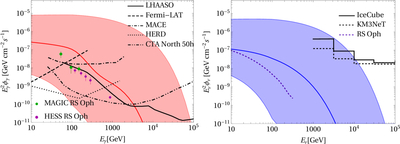
Caption: Figure 2.
This figure shows the range of gamma-ray and neutrino fluxes for T CrB from the ES model. Left: gamma-ray flux (red curve) with model uncertainties (red band). Black lines show the sensitivities of LHAASO (solid curve), MACE (dotted–dashed curve), Fermi-LAT (dashed curve), and HERD (dotted curve). The green and dark-magenta data points are the observed flux of RS Oph at day 1 by MAGIC (V. A. Acciari et al. 2022) and HESS (S. De Wolf et al. 2022), respectively. Right: muon neutrino flux (blue curve) with model uncertainties (blue bands). The purple dotted curve shows the neutrino flux estimation from RS Oph (V. A. Acciari et al. 2022). The solid and dotted black lines show the sensitivities of IceCube and KM3NeT, respectively.
Other Images in This Article
Copyright and Terms & Conditions
© 2026. The Author(s). Published by the American Astronomical Society.