Image Details
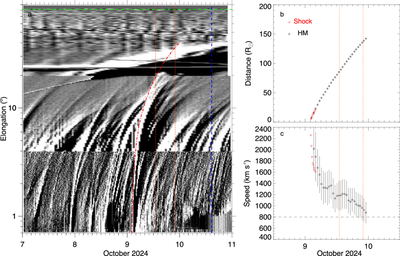
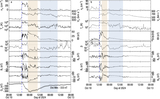
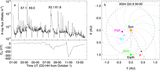
Caption: Figure 4.
Kinematics of the October 9 CME. (a) Time-elongation map constructed from RD images of COR2, HI1, and HI2 from STEREO-A along the ecliptic plane. The red curves indicate the CME track. The green horizontal dashed line denotes the elongation angle of the Earth. The blue vertical line shows the arrival time of the CME shock at the Earth. (b) Radial distance and (c) speed profiles of the CME leading edge derived from the spheroid shock model (red) and the HM approximation (black). The horizontal dashed line in (c) represents the shock speed of about 800 km s−1 at Wind. Orange dotted lines bracket the comet-obscured area.
Other Images in This Article
Copyright and Terms & Conditions
© 2026. The Author(s). Published by the American Astronomical Society.