Image Details
Caption: Figure 1.
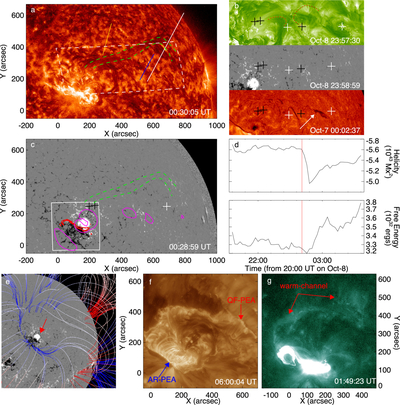
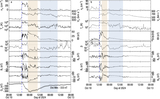
Multiwavelength solar observations of the sympathetic eruption on 2024 October 9. (a) Rising QF (green) at AIA 304 Å. Colored slits indicate positions used for time–distance analysis of the QF rising motion and flare ribbon expansions. (b) EUVI 195 Å image showing the region of filament formation (dashed quadrilateral in panel (a)). Footpoints of the two reconnected filament segments are marked by black and white crosses on the coaligned HMI magnetogram and CHASE Hα image; the white arrow points to the filament barb. (c) HMI magnetogram of AR 13848 and the nearby region. The white square outlines the domain used for magnetic field extrapolation in panel (d); red contours mark the brightened sigmoid structure at AIA 94 Å; magenta contours show the decay index n = 1.5 isosurface at a height of ∼50 Mm. (d) Time evolution of magnetic helicity and free energy of the AR. (e) Large-scale magnetic fields by PFSS surrounding the AR. (f) PEAs associated with the two CMEs at AIA 193 Å. (g) Inverted δ-shaped warm-channel structure at AIA 94 Å. An animation of panel (a) shows the QF rising process in multiwavelength AIA observations (01:38–02:53 UT, 19 s duration).
(An animation of this figure is available in the online article.)
(An animation of this figure is available.)
The video/animation of this figure is available in the online journal.
Other Images in This Article
Copyright and Terms & Conditions
© 2026. The Author(s). Published by the American Astronomical Society.