Image Details
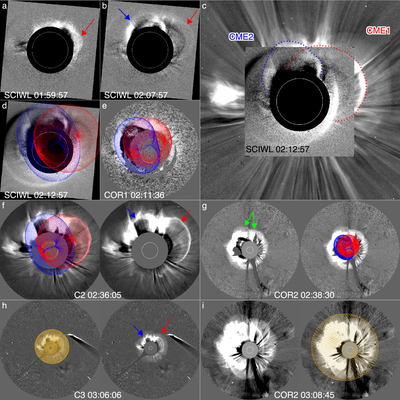
Caption: Figure 3.
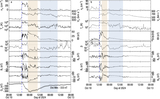
Evolution of two CMEs observed by coronagraphs on October 9. (a) and (b) Running-difference (RD) white-light images observed by ASO-S/SCIWL. Red and blue arrows indicate CME1 (QF-CME) and CME2 (AR-CME), respectively. (c) Composite RD images of SCIWL and LASCO/C2. Red and blue dotted lines outline the leading edges of two CMEs. (d) and (e) GCS wireframes overplotted on SCIWL and STEREO-A/COR1. Blue (red) wireframe corresponds to AR-CME (QF-CME). (f) and (g) GCS modeling from C2 and STEREO-A/COR2. The green arrows indicate two distinct shocks. (h) and (i) Spheroid shock modeling (golden) from LASCO/C3 and COR2. An animation of panels (a) and (b) shows two CMEs with distinct leading edges propagating outwards in the SCIWL from 01:57 to 02:55 UT (2 s duration).
(An animation of this figure is available in the online article.)
(An animation of this figure is available.)
The video/animation of this figure is available in the online journal.
Other Images in This Article
Copyright and Terms & Conditions
© 2026. The Author(s). Published by the American Astronomical Society.