Image Details
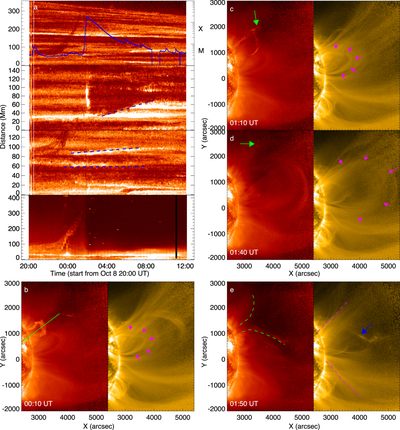
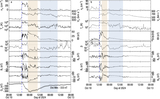
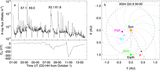
Caption: Figure 2.
Off-limb observations of the rising filament (prominence) by SolO. (a) Time–distance plots from the slits of Figures 1(a) and (b). GOES X-ray flux is overplotted. The blue dashed lines indicate the separation motions of flare ribbons. (b)–(e) Evolution of the filament (indicated by green arrows) by EUI/FSI 304 Å and 174 Å. The magenta arrows indicate the expansion of the overlying loop above the AR. The blue arrow marks the coronal loops distorted by the filament eruption. An animation of panels (b)–(e) that showcases the QF and AR eruptions in the FSI from 00:00 to 03:00 UT (1 s duration).
(An animation of this figure is available in the online article.)
(An animation of this figure is available.)
The video/animation of this figure is available in the online journal.
Other Images in This Article
Copyright and Terms & Conditions
© 2026. The Author(s). Published by the American Astronomical Society.