Image Details
Caption: Figure 1.
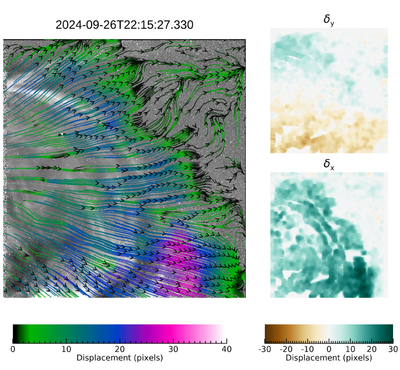
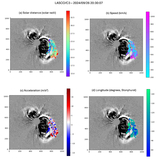
Results from the application of the optical flow. We represent the displacements as streamlines over the corresponding WISPR image in the left panel. The bottom right and top right panels indicate the displacements of each pixel in the horizontal δx and vertical δy directions, respectively. The color bar associated with these two panels is shown below them. An animation describing the overall evolution of streamlines and displacements is available in the online version of the journal. The total runtime is 12 s.
(An animation of this figure is available in the online article.)
(An animation of this figure is available.)
The video/animation of this figure is available in the online journal.
Other Images in This Article
Copyright and Terms & Conditions
© 2026. The Author(s). Published by the American Astronomical Society.