Image Details
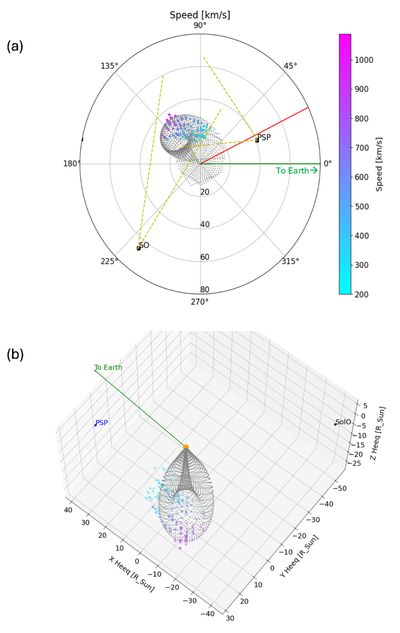
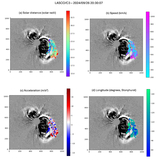
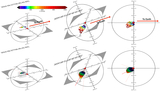
Caption: Figure 4.
(a) Heliospheric polar view (from north downward) comparing GCS and MOSAIK3D results at 2024 September 26 21:00 UT. The FOVs from SoloHI (tiles 1 and 2) and WISPR-I are indicated by the yellow dashed lines. The red and green lines indicate the direction to STEREO-A/SECCHI and SOHO/LASCO, respectively. (b) Same as panel (a), but in a 3D plot. PSP and SolO are represented by the blue (left) and black (right) squares, respectively. An animation is available in the online version of the journal for panel (b), where the 3D plot is rotated 360° along the z-axis. The total runtime is 12 s.
(An animation of this figure is available in the online article.)
(An animation of this figure is available.)
The video/animation of this figure is available in the online journal.
Other Images in This Article
Copyright and Terms & Conditions
© 2026. The Author(s). Published by the American Astronomical Society.