Image Details
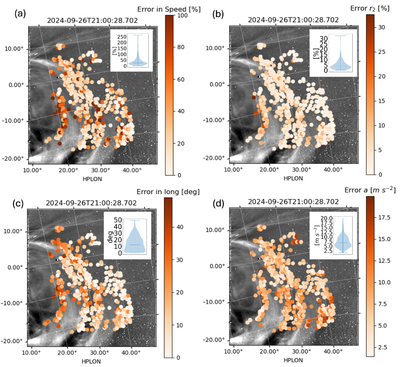
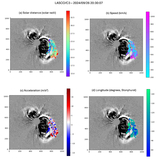
Caption: Figure 3.
Errors in (a) initial speed, (b) r2(t0), (c) longitude, and (d) acceleration for each selected point projected on a WISPR-I image, as determined by the residual. Each error in speed and position is normalized by the respective value. The insets in each panel show violin plot distributions of errors, with horizontal lines indicating the minimum, median, and maximum values.
Other Images in This Article
Copyright and Terms & Conditions
© 2026. The Author(s). Published by the American Astronomical Society.
Copyright ©
2026 Astronomy Image Explorer. All Rights Reserved.