Image Details
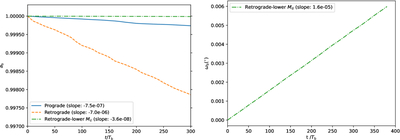
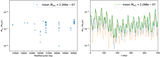
Caption: Figure 8.
Left: ab vs. Tb for prograde (blue), retrograde (orange dashed), and retrograde with the lower Md (green dotted–dashed) cases. The slopes in the legend indicate the ﹩\dot{{a}_{{\rm{b}}}}﹩ rates for three simulations. Right: Time evolution of ωb for the retrograde disk simulation.
Other Images in This Article
Copyright and Terms & Conditions
© 2026. The Author(s). Published by the American Astronomical Society.
Copyright ©
2026 Astronomy Image Explorer. All Rights Reserved.