Image Details
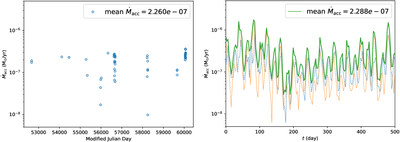
Caption: Figure 7.
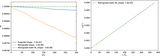
Left: the fitting results of ﹩{\dot{M}}_{{\rm{acc}}}﹩ of DX Cha across the 93 epochs shown as empty circles. Right: the new ﹩{\dot{M}}_{{\rm{acc}}}﹩ of DX Cha with the time in our simulations after we reduce the disk mass in our model from the original value given in the setup (Section 2) by a factor of ≈200. The blue and orange dashed lines represent ﹩{\dot{M}}_{{\rm{acc}}}﹩ of the primary and the secondary of DX Cha in the retrograde simulation, respectively. The green line is the total ﹩{\dot{M}}_{{\rm{acc}}}﹩.
Other Images in This Article
Copyright and Terms & Conditions
© 2026. The Author(s). Published by the American Astronomical Society.
Copyright ©
2026 Astronomy Image Explorer. All Rights Reserved.