Image Details
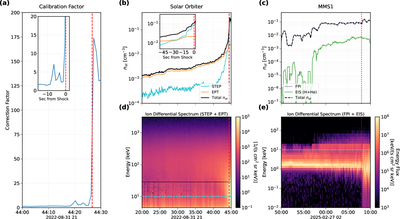
Caption: Figure 4.
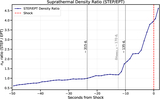
Derivation of suprathermal ion density (nst) for Solar Orbiter and MMS. (a) Time-varying calibration factor for Solar Orbiter STEP data, derived to correct for dead-time saturation near the shock (red dashed line). (b) Solar Orbiter nst time series. The density (black) sums the STEP (cyan) and EPT (orange) components. The inset highlights the rapid density increase driven by STEP immediately upstream. (c) MMS nst time series, combining contributions from FPI (purple, <30 keV) and EIS (green, >30 keV). The vertical red dotted line marks the shock crossing. (d) Combined Solar Orbiter dynamic spectrum (STEP + EPT) used for integration. (e) Combined MMS dynamic spectrum (FPI + EIS). The cyan dashed lines in panels (d) and (e) show the minimum energy used for the suprathermal density integration.
Other Images in This Article
Copyright and Terms & Conditions
© 2026. The Author(s). Published by the American Astronomical Society.