Image Details
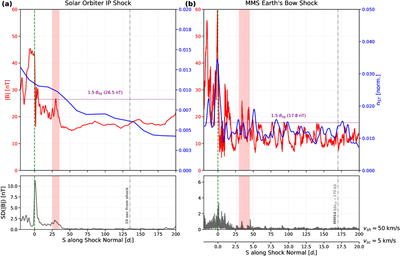
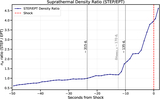
Caption: Figure 3.
Comparative analysis of magnetic field and suprathermal particle properties across collisionless shocks. Panel (a) shows Solar Orbiter IP shock observations, while panel (b) presents MMS1 measurements of Earth’s bow shock. For each shock event, the upper plots display the magnetic field magnitude ∣B∣ (red line) and normalized suprathermal particle density (nst/nsw; blue line) as functions of distance along the shock normal. The lower plots show the magnetic field SD σ(B) using a 15-data point moving window, which quantifies local variability levels. The x-axis represents distance in upstream ion inertial lengths (di) from the shock crossing (S = 0). The background magnetic field is defined as the average value from observations taken at >100 di. Red shaded regions highlight the presence of “compressive structures” occurring at the same relative distance of ∼25–50 di. The two horizontal axes on MMS plots indicate the spatial distance computed with the calculated shock speed along the normal and with the spacecraft speed, representing the upper and lower bounds of the distance from the shock, respectively, while the relative location of MMS4 bounds this in context to Figure 1. More information and details about the suprathermal density and their profiles are detailed in Appendix B and in the associated supplementary plots (Figures 4 and 5).
Other Images in This Article
Copyright and Terms & Conditions
© 2026. The Author(s). Published by the American Astronomical Society.