Image Details
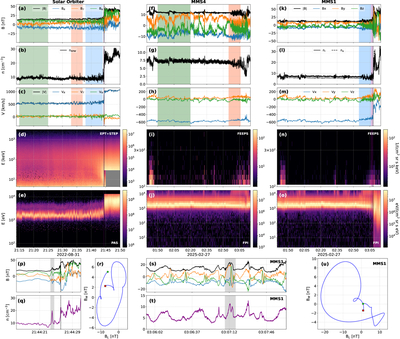
Caption: Figure 1.
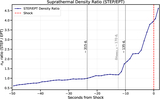
Time-series data for the collisionless shock observations and associated foreshock for Solar Orbiter and MMS, in RTN and GSE coordinates, respectively. Panels (a)–(c), (f)–(h), (k)–(m) show the magnetic field (nT), plasma density (cm−3), and bulk ion velocity (km s−1). Energetic and suprathermal ion fluxes (keV) are displayed in panels (d), (i), (n) from EPT+STEP and FEEPS, while the lower-energy ion energy fluxes (eV) are shown in (e), (j), (o) from the Proton-Alpha Sensor and FPI. Shaded regions in the time-series panels denote different plasma environments denoted as “solar wind” (green), “far foreshock” region (orange), and “close foreshock” (blue), as described in the text and in Figure 2. The bottom row (p)–(u) details an FCS observed by Solar Orbiter and one of the compressive structures observed by MMS1. Panels (p), (q), (s), (t) show zoomed-in time series of the magnetic field (nT) and density (cm−3). The MVA interval is shaded in gray, while the wider interval of the zoomed-in panels is shaded in purple in the main time-series panels. The corresponding hodograms in the L–M plane (nT) are shown in (r), (u), with the green and red dots corresponding to start and end points, respectively. The shaded area of Solar Orbiter observations (p), (q) and MMS (s), (t) correspond to 1 and 10 s, respectively. Vertical black dashed lines denote the shock time for both the IP and the bow shock.
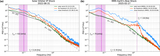
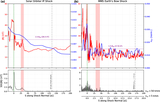
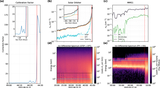
Other Images in This Article
Copyright and Terms & Conditions
© 2026. The Author(s). Published by the American Astronomical Society.