Image Details
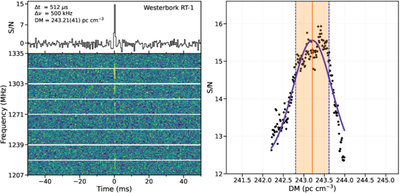
Caption: Figure 5.
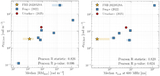
(Left) L-band dynamic spectrum of the FRB 20220529A burst detected by Westerbork. A frequency-averaged burst profile is presented in the top panel. (Right) Peak S/N of the burst at a range of DM trials with the peak DM represented by a red vertical line and the 1σ uncertainty region around the peak, where the S/N drops by 1, is highlighted in orange.
Other Images in This Article
Copyright and Terms & Conditions
© 2026. The Author(s). Published by the American Astronomical Society.
Copyright ©
2026 Astronomy Image Explorer. All Rights Reserved.