Image Details
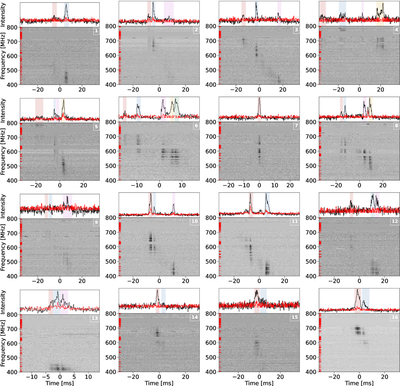
Caption: Figure 1.
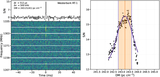
Total intensity dynamic spectra, dedispersed to their best-fit DMs, for the 16 FRB 20220529A bursts with baseband data detected by CHIME/FRB. All dynamic spectra have a frequency resolution of 390.625 kHz and have been downsampled to a common time resolution of 163.84 μs to ensure a sufficient S/N in fainter bursts. Frequency-averaged total intensity (black) and linearly polarized intensity (red) profiles are plotted above the dynamic spectra. Individual burst components are highlighted by shaded regions (in chronological order for multiple components: red, blue, purple, yellow, and green) overlaid on the intensity profiles. Channels masked out due to radio frequency interference are highlighted in red on the left of the dynamic spectra.
Other Images in This Article
Copyright and Terms & Conditions
© 2026. The Author(s). Published by the American Astronomical Society.